Adventure Travel Industry Trends Over Time
For nearly two decades, the global adventure travel community has relied on ATTA’s Trends & Insights (formerly Snapshot) research to understand not only what is happening in the market today, but how the sector has evolved over time. Drawing on almost 20 years of operator surveys, traveler research, and industry benchmarking, this resource provides historical perspective on traveler behavior, business performance, product development, and shifting motivations across the adventure travel sector.
The purpose of the data and analysis on this site is to visually understand the time period from 2019 through 2024 (reports dated 2020-2025). For links to all 6 of these reports, and previous ones available online, see the bottom of this page. The number of survey respondents (n) and additional details are available for each individual question in those reports. While the COVID-19 period marked a notable disruption, the broader value of this research lies in its ability to reveal long-term patterns and cycles. By examining how the industry has responded to change over time, ATTA helps the adventure travel community better interpret current signals and make more informed decisions about the future.
Historical data helps answer questions such as:
- Which traveler motivations have proven resilient across market cycles
- How demand for different types of adventure experiences has evolved
- What past growth and contraction periods reveal about industry adaptability
- This perspective allows businesses to plan with greater confidence and resilience, grounded in evidence rather than reaction.
This open version offers high-level historical insight and thought leadership for the wider ATTA network. Access to the most current data, detailed analysis, and forward-looking research is available to ATTA members.
The 2026 Adventure Travel Trends & Insights Report will be released in spring 2026.
Profile & Staffing
While part-time staffing has remained relatively stable over the past six years, full-time employees and non-staff subcontractors (such as guides and drivers) declined during the period of disruption, rebounded in 2022, and stabilized through 2023–2024.

Guests
Viewed in historical context, the charts show a sharp contraction across regions in 2020, followed by a gradual and uneven recovery that stabilized by 2023 and continued into 2024. Median guests served increased steadily, with most regions settling into a more stable range rather than returning to rapid growth. Europe stands out as an exception, sustaining higher guest volumes from 2022 onward. Africa’s recovery has progressed more slowly, though 2024 data suggests renewed momentum; smaller sample sizes limit deeper comparison.
Operational indicators mirror this longer-term pattern. Guests per guide declined in 2020 and converged across regions by 2023–2024, pointing to stabilized group sizes rather than increased guide workloads. Trip fill rates improved through 2022 before plateauing, remaining below 2019 levels in most regions — signaling structural adjustment rather than a full return to earlier norms.
* Latin America includes South America and Central America / Caribbean
Bookings
Over time, the balance between direct bookings and those made through travel advisors has remained largely consistent. From 2019 through 2024, the share of direct bookings fluctuated within a narrow range, indicating stability rather than structural change. North America consistently records the highest proportion of direct bookings, while Latin America continues to show the lowest share, despite modest gains after 2022. By 2024, direct bookings declined slightly overall, suggesting gradual channel diversification rather than a shift away from direct sales.
Travel advisor bookings show a similarly steady pattern, generally ranging from the mid-teens to low twenties. Asia Pacific and Latin America experienced a temporary increase in advisor use in the early 2020s, followed by a return toward longer-term norms by 2023–2024. Taken together, the data indicate that distribution channels have adjusted over time but ultimately reflect durable booking behaviors rather than lasting transformation.
* Latin America includes South America and Central America / Caribbean
Revenue & Profit
The first two charts present revenue distribution in different formats, while the third highlights year-over-year change. Together, they show a pronounced revenue contraction in 2020, followed by continued pressure in 2021 and a broad recovery beginning in 2022. The share of operators reporting very low annual revenue peaked in 2020 and declined steadily thereafter, as mid- and higher-revenue categories expanded.
By 2023, revenue distributions for many operators had largely returned to earlier norms, with further consolidation in 2024. Year-over-year data reinforce this pattern: declines were widespread in 2020, outcomes were mixed in 2021, and stable or increasing revenue became more common from 2022 onward. By 2024, nearly half of respondents reported modest growth (under 25%), indicating a shift from recovery toward stabilization rather than rapid expansion.
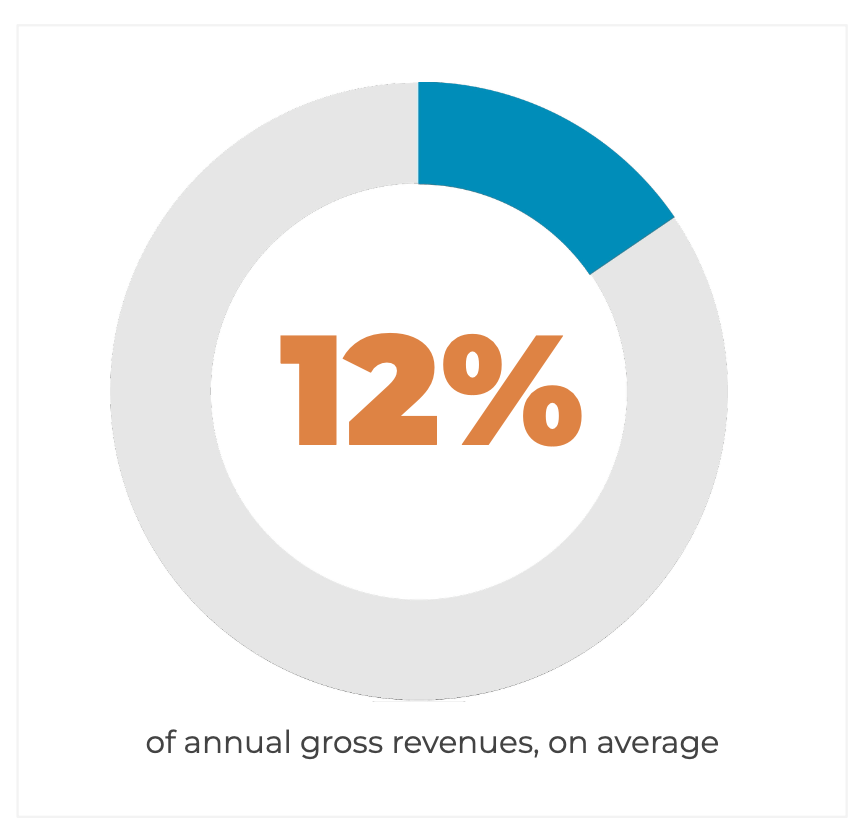
Marketing & Sales
Respondents' marketing budget has consistently hovered around 12-14% of annual gross revenues on average over the past 6 years.
Sustainability
This chart shows the percentage of respondents that have or are working towards a sustainability certification. It appears that prioritizing sustainability has steadily increased since 2019, with an unexpected peak in 2022.
Safety & Risk Management
Similar to the sustainability certification trend above, having a safety and risk management plan also peaked in 2022 and leveled off in 2023.
Consumer Trends
Hiking, trekking, and walking have consistently ranked among the most popular adventure travel activities, with the only notable shift occurring in 2021, when cycling—driven largely by electric bike itineraries—briefly moved into first place. Culinary and gastronomy-focused activities, cultural experiences, safaris and wildlife viewing, and wildlife and nature photography have also remained top-ranked over time, with culinary experiences continuing to gain momentum through 2024.
Trip-type demand has remained highly stable. Custom itineraries have held the top position every year since 2019, highlighting the continued importance of personalization. Remote destinations and expert- or specialist-guided trips have also consistently ranked highly, while culinary-focused adventures have steadily increased in demand since 2020. Soft adventures entered the top tier more recently, first appearing among the most in-demand trip types in 2023.
Motivations for adventure travel have shown remarkable consistency, with new experiences, going off the beaten track, and traveling like a local remaining the top three motivations since 2019. A brief shift in 2022 saw motivations such as adventure travel as a status symbol and popular adventures rise in rank, reflecting a period of post-pandemic “revenge travel,” before trends largely normalized in 2023 and 2024.
Destination trends have varied more year to year, though the Mediterranean, Western Europe, and Scandinavia have remained consistently popular. The United States and Canada also continue to rank highly in recent years (prior to 2020 they were combined into North America so individual data is not available).
Learn More
The above is only a small glimpse into what our annual Industry Trends & Insights (Snapshot) reports reveal about the adventure travel industry.
For more information on findings and metholodogies, you can download the full reports below.
All Annual Industry Trends (Snapshot) Research Reports:
